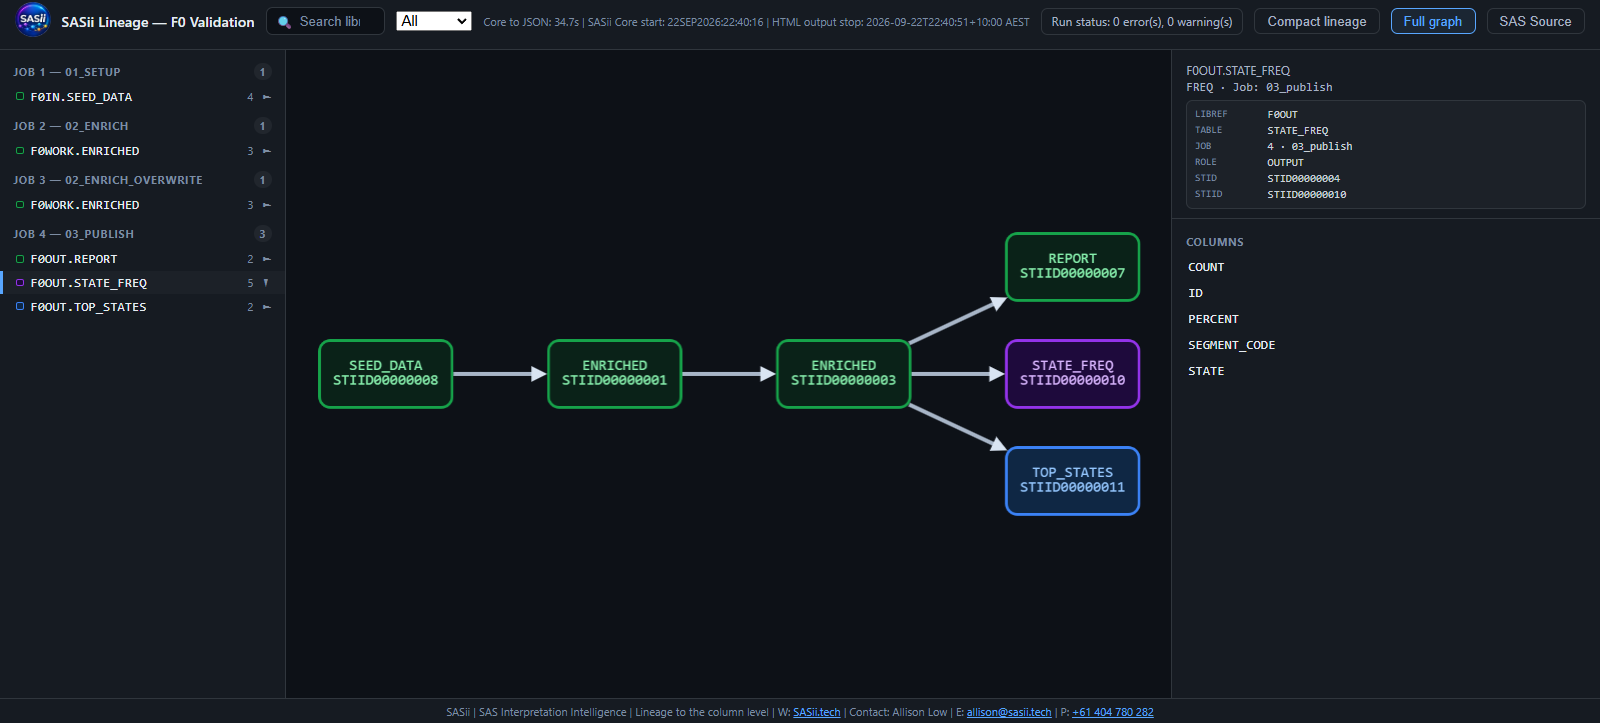
Lineage of final_average
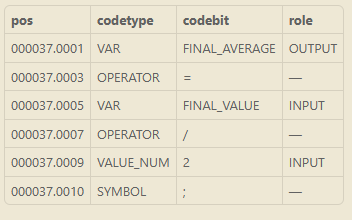
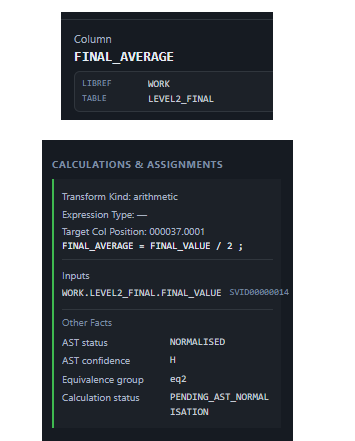
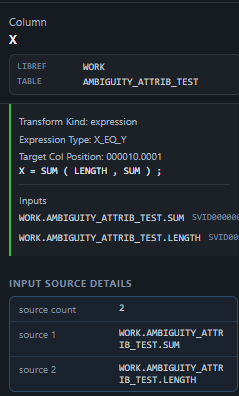
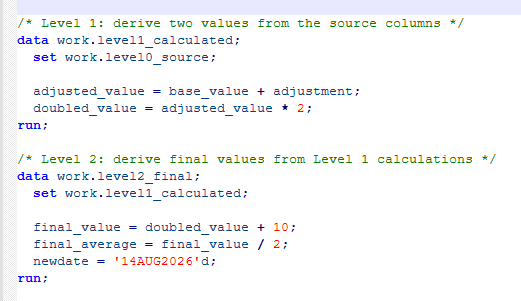
A calculation-focused example showing SAS source, the structured engine-room evidence and the resulting column lineage.


The visual lineage is one way to explore ELSii. The structured lineage database is the product: it holds the relationships, transformations and supporting evidence behind the lineage.
See ELSii trace rich lineage through jobs, tables, columns, calculations and supporting SAS code.
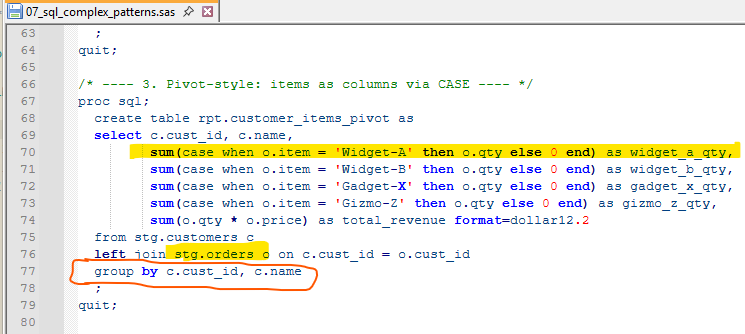
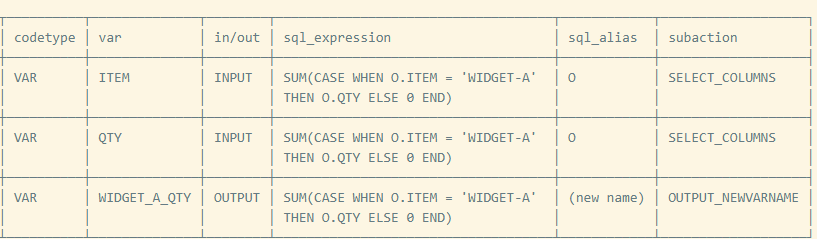
These examples show the same progression used in the ELSii demo: SAS code or logs → the ELSii parsing engine room → column-level lineage graphics. Each example exposes different SAS behaviour and the evidence ELSii reconstructs behind it.
final_averageA calculation-focused example showing SAS source, the structured engine-room evidence and the resulting column lineage.


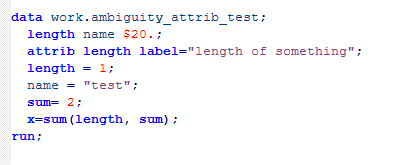
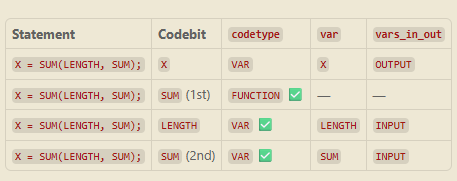
Shows how ELSii carries the supporting context needed to resolve lineage where a variable name alone is not sufficient.


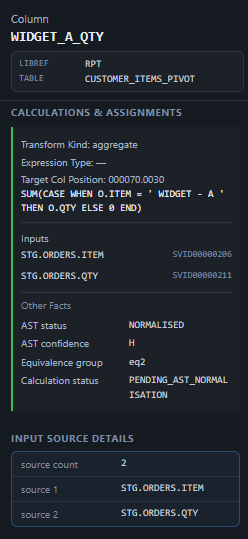
widget_a_qtyA multi-input example showing how ELSii traces a target column through calculations and source variables.


The ELSii lineage database can connect to your organisation’s enterprise lineage or visualisation tools. This example uses ELSii JSON with our HTML visualiser, providing searchable, interactive and drillable lineage with detailed column evidence and SAS source. The HTML visualiser can also be tailored to your needs.
A useful discovery tool should not turn uncertainty into false precision. ELSii can preserve whether a relationship is strongly supported, relies on fallback logic, remains unresolved or needs targeted review.
Indicative timings from ELSii development testing on a laptop (2GHz, 32GB RAM), using flows of increasing size and complexity.
Development benchmark results only; processing time will vary with code complexity, environment and available execution evidence.
ELSii currently has around 230 component test scripts for automated, repeatable testing. The test framework runs targeted SAS cases through the pipeline and audits the results so passes, mismatches, diagnostics and unresolved behaviour remain visible.
The audit is deliberately not a green-tick marketing screen. When a component needs investigation, the dashboard shows it. That makes coverage and accuracy something that can be measured and improved rather than simply claimed.
ELSii maps the existing SAS estate — its lineage, calculations and dependencies — so teams know what must be carried forward. Regression testing then checks whether the migrated implementation produces the expected output. Together they support understanding before migration and validation after it.
| Migration stage | How ELSii can help |
|---|---|
| Before | Discover dependencies, scope the estate and identify business logic |
| During | Capture transformations, calculations and the dependencies that must be preserved |
| Validation | Trace mismatches back through the lineage to the relevant source logic |
A short demo can cover the surface view; a longer session can go into the lineage model and technical detail.